July 28, 2026
How to Quote Commercial Cleaning Jobs with Confidence
Learn how to quote commercial cleaning jobs with practical formulas, pricing models, and follow-up tips that help your cleaning business win more contracts.

Wednesday, July 29, 2026
Master operational efficiency metrics for residential and commercial cleaning. Learn formulas, benchmarks, and how Estimatty automates tracking.
You're staring at a dashboard full of numbers, and the business still feels stuck. The schedule is packed, the crews are busy, the phone keeps ringing, but the bank account doesn't match the motion. That's the trap in cleaning, a lot of numbers look healthy until you ask the only question that matters, what changed because of them?
The best operational efficiency metrics cut through that noise. They show whether labor, travel time, supplies, and admin work are turning into profitable service, or leaking out through rework, callbacks, and rushed jobs. In a cleaning company, your “factory floor” is a home, an office, or a jobsite, so the metric only matters if it helps you protect quality while you grow.
A lot of owners start with the easiest number to see, total revenue. Others watch job count, hours billed, or how full the calendar looks, then assume the business is efficient because the team stays busy. I've lived that phase. It feels productive right up until the month closes and you realize the crew ran hard, but the margin barely moved.
That's where operational efficiency metrics separate signal from clutter. These numbers measure how effectively you convert labor, time, materials, and admin work into output, instead of just measuring activity. The difference matters because a cleaner who finishes ten jobs with heavy rework is not more efficient than a cleaner who finishes eight jobs cleanly and keeps the client.
A smart dashboard starts with the metrics that drive decisions, not the ones that make the page look full. OEE, for example, breaks performance into availability × performance × quality and is widely used to expose hidden production losses in manufacturing. 85% OEE is widely cited as a world-class benchmark in BOC Group's operational excellence overview, and the same framework is useful here because it forces you to separate speed from quality. Cleaning is not a factory, but the logic still holds.
For a cleaning business, the same principle applies. Track a small set of numbers that explain why jobs are profitable or painful, then ignore the rest until they affect a decision. A sprawling dashboard with 20-plus metrics usually gives owners a false sense of control, while 4 to 6 well-chosen metrics make it obvious where labor, travel, or quality is slipping.
Practical rule: if a metric doesn't change how you schedule, price, coach, or hire, it's decoration.
That's why I'd rather see an owner watch cycle time, first-time fix rate, utilization, and cost per job closely than chase a pile of vanity totals. If the numbers can't tell you when to raise rates, tighten routing, or retrain a crew lead, they're not doing real work. The same is true for accounting screens. If your reporting hides labor creep, rework, and travel waste, review your cleaning business accounting guide and make sure the numbers are tied to actual operating decisions. If you want a better read on margin pressure, the HireAccountants operating margin guide is useful context, because margin is where busy-looking work either proves itself or falls apart.
The core metrics are simple, but only if you define them cleanly and use them the same way every week. Cleaning companies get into trouble when one person measures a job from arrival to departure, another measures from dispatch to lock-up, and a third includes callbacks only when they're inconvenient. Consistency matters more than fancy software.
Here's the working set I'd trust first.
| Metric | Formula | Residential Benchmark | Commercial Benchmark |
|---|---|---|---|
| Cost per Job | Total job costs ÷ total jobs | Track all labor, travel, and supplies per home | Add equipment depreciation and crew coordination overhead |
| Labor Utilization Rate | Productive labor time ÷ total available labor time | Watch for idle gaps between homes | Watch for coverage across sites and shift handoffs |
| Cycle Time per Service Type | Total process time ÷ number of units | Measure a standard clean, deep clean, or move-out | Measure recurring suites, offices, or common areas |
| First-Time Fix Rate | Jobs completed correctly on the first visit ÷ total jobs started | Use it to catch missed rooms or checklist gaps | Use it to reduce repeat visits and contract friction |
| Operational Efficiency Ratio | Operating expenses + COGS ÷ net sales | Lower is better if service quality stays stable | Lower is better if contract service doesn't slip |
The operational efficiency ratio is especially useful because it gives you one number that shows whether the business is getting leaner or bloated over time. It's the same structure used by IBM and Runn, calculated as operating expenses plus cost of goods sold divided by net sales, and IBM notes that organizations use it to measure operational efficiency while Runn presents the same formula in that exact structure. IBM's operational efficiency overview is a solid reference point for the concept.
A residential deep clean might look profitable on paper until you add drive time, supply restocks, and a second trip for a missed shower. A commercial office contract can look slim until you factor in equipment wear, supervisor time, and handoff coordination between crews. That's why cost per job has to reflect the complete service model, not just the invoice.
For owners who want a finance lens alongside the operating lens, HireAccountants' operating margin guide is useful context because it helps you compare job-level efficiency to the bigger profitability picture. It's not the same metric, but it tells you whether cleaner operations are showing up in margin.
The math gets easier when labor is measured correctly, so keep a close eye on how to calculate labor cost per hour as a companion to job costing. If labor is off, every other efficiency number gets muddy fast.
Practical rule: a job that was “fast” but required a callback is not efficient, it's just incomplete.

The obsession with high utilization is one of the easiest ways to damage a cleaning company while thinking you're improving it. Crews that are scheduled too tightly don't get faster in a healthy way, they get rushed. That rush shows up later as missed details, more callbacks, more fatigue, and more churn.
A better target is optimal utilization, not maximum utilization. The point is to keep crews productive without stripping out the slack that protects quality, travel, and response time. In service work, a little breathing room often saves far more than it costs because it prevents a broken day from turning into a broken week.
Residential cleaning makes this tradeoff obvious. Homeowners often call multiple companies, and the business that answers first usually wins the conversation. If your team is fully packed and nobody can respond quickly, you may save a little labor in the moment and lose the client entirely to the cleaner who replied first. That's why peak-time responsiveness and after-hours coverage matter so much.
Commercial work has its own version of the same problem. A crew running hot across multiple sites can look efficient while creating rework, missed access windows, and strained client communication. The client doesn't care that the utilization number is high if the hallway still has dust on Friday morning.
The better framework is resilient efficiency, which means you balance throughput with service quality and coverage. A company at 80% utilization with strong first-contact resolution can outperform a company at 95% utilization that's drowning in callbacks and complaints, because the second company keeps paying for mistakes it created under pressure.
Here's the operational reality.
That's where AI-assisted estimating and scheduling can change the math. A system that handles first contact, captures job details, and keeps the inbox moving after hours gives your team room to stay accurate during the day. Time and attendance software guidance matters here too, because you can't protect utilization if your time data is messy.
The point isn't to relax standards. It's to stop confusing a full calendar with a healthy operation.
If you want the same idea in video form, this overview is worth watching.
Residential and commercial cleaning both depend on efficiency, but they reward different behaviors. Residential work is more variable, more emotional, and more sensitive to response speed. Commercial work is more contract-driven, more schedule-heavy, and more exposed to coordination costs across sites.
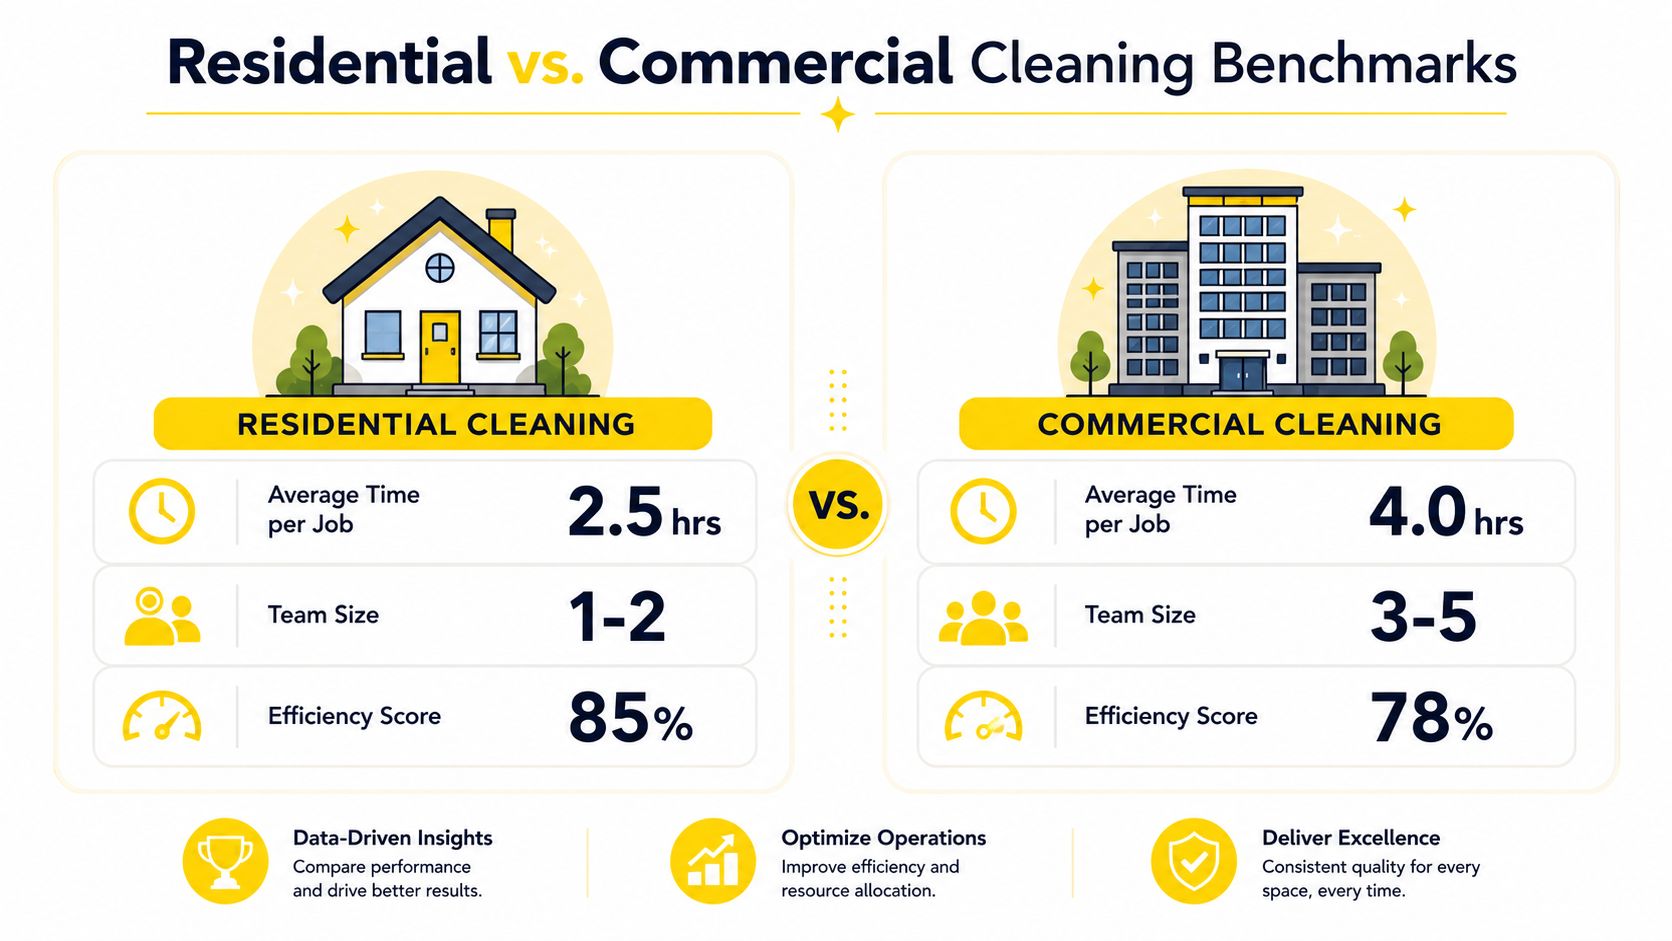
A useful way to think about it is through the unit of service. In residential work, the unit is often a single home, a room set, or a recurring visit. In commercial work, the unit may be a building zone, a floor, or a repeat contract with multiple access rules. The same metric can matter in both, but the decision it informs is different.
For residential cleaning, first-response time and first-time fix rate carry extra weight. A homeowner usually wants a quick answer, a clear estimate, and confidence that the crew will get it right the first time. If the business is slow to respond, the client often moves on before the price is even discussed.
Commercial cleaning leans more toward contract stability and crew utilization across sites. One missed handoff can affect a larger service relationship, so the costs of coordination and supervision matter more. A commercial team may tolerate slightly longer setup because the contract value is recurring and the workflow is more predictable.
Seasonality changes the picture too. Residential demand can swing hard around move-outs, holidays, and spring reset periods, while commercial operations are more likely to feel the pressure of staffing gaps and site-specific access issues. During slower periods, watch for underused crews and shrinking quote volume. During peak periods, watch for response delays, missed details, and schedule spillover.
The practical benchmark is not “which segment is better.” It's which metric matches the way the work is sold and delivered. Residential owners should usually pay closer attention to estimate speed, job completion quality, and how often a client needs follow-up. Commercial owners should watch contract profitability, multi-site crew utilization, and repeat-visit friction.
Practical rule: compare your business to businesses that sell the same way you do, not to whichever company has the prettiest dashboard.
That's the mistake that leads owners to chase the wrong benchmark. A residential house cleaning company shouldn't brag about the same efficiency score a janitorial contractor uses if the service model, sales cycle, and client expectations are completely different.
Good metrics break down fast when the data entry is sloppy. I've watched cleaning businesses build polished spreadsheets, then find out crew leads logged jobs late, office staff used different timing rules, and the numbers no one trusted still made decisions. The fix is to capture data at the source, then automate as much of the handoff as possible.
Start with the inputs that show real work. Time-tracking apps tell you how long crews stayed on site. Supply inventory systems show where material costs are drifting. Customer feedback loops surface missed details and repeat issues. CRM integration ties each job back to the estimate, the booking, and the follow-up, so you can see where a job went sideways instead of guessing after the fact.
The estimate stage carries a lot of that truth. Tools like Estimatty can capture request timing, square footage, surface details, and conversion events automatically, which cuts down the reconstruction errors that come from voicemail and memory. Data collection software guidance is useful if you are cleaning up the rest of your stack too.
Use the data in a way people can read quickly. Google Data Studio or a well-built spreadsheet can show cycle time trends, callback spikes, and utilization shifts without burying you in clutter. Weekly scorecards work best when they stay simple, visible, and tied to a direct action.
A clean dashboard usually includes these elements:
Practical rule: if you cannot explain the chart in one sentence to a crew lead, the chart is too complicated.
For owners building a more organized management system, build a project system in Workspace is a helpful reference because a lot of efficiency tracking falls apart when task flow is scattered across texts, email, and sticky notes. A clean workflow makes the numbers believable.
The best data system is the one crews will use. Manual tracking usually breaks first during busy season, which is when you need the numbers most.
The fastest path to better efficiency is not a big rewrite. It's a disciplined three-phase rollout that starts with observation, then makes small changes, then scales what works. Most owners try to fix everything at once and end up changing nothing that sticks.
Pick your top four metrics and freeze the definitions. Track them without changing routing, pricing, or staffing, because you need a clean baseline before you can judge improvement. Make sure one person owns each metric, since ownership prevents the “nobody updated it” problem.
Use the baseline to attack the biggest drains. That might mean reducing travel between residential jobs, tightening checklists, or standardizing how crews mark job completion. If your team still manages work in a scattered way, a project system in Workspace can help centralize tasks, but only if the process behind it is clear.
Once the data starts to settle, reinforce the changes that improved results and drop the ones that didn't. If utilization shows you're consistently turning away work, that's the moment to think about hiring, possibly with support from pipehirehrm.com for the recruiting side. Don't add headcount before you know the bottleneck is real.
A simple 90-day rhythm keeps the work manageable.
Crew resistance is normal, especially around time tracking. Inconsistent data entry is also normal. What's not normal is expecting a cleaner dashboard without better discipline behind it.
The best cleaning businesses don't treat operational efficiency metrics like a reporting chore. They treat them like a steering wheel. Once the numbers are stable, the monthly review gets shorter, the decisions get sharper, and the business stops depending on guesswork.
That's the fundamental shift. Metrics should help you run a business that scales from solo operator to multi-crew operation without losing service quality or burning people out. A five-person team may only need a handful of measures, while a larger operation needs more structure, more ownership, and tighter review cadence. The measurement system has to grow with the company, or it turns into noise.
A good monthly review should stay under 30 minutes. Look at what moved, ask why it moved, and decide whether the change was caused by scheduling, pricing, training, or demand. If a metric hasn't influenced a decision for a while, retire it and replace it with something more useful.
The strongest connection is between operations and pricing. When every estimate interaction is captured cleanly, you stop guessing where profit is leaking and start pricing with real patterns. That's where service-business software earns its keep, because the data you collect during quoting, booking, and follow-up can shape the whole business. Service business software guidance is a useful lens for that transition.
The long-term goal is not to squeeze every possible minute out of your crews. It's to build a cleaning company that delivers excellent work profitably, keeps clients longer, and gives you room to step away from daily fire drills. Metrics are only valuable when they make that kind of business easier to run.
If you want your estimates, booking flow, and operational data working together instead of living in separate silos, Estimatty is built for that. It helps cleaning businesses capture job details fast, standardize pricing, and turn more inquiries into booked work without adding extra admin.