October 28, 2026
Commercial Cleaning Services Price List: Rates for 2026
Commercial cleaning services price list with 2026 benchmark rates per square foot, per hour and per visit, plus a template to build standardized quotes.

Thursday, October 29, 2026
Labor and burden is more than the wage. Calculate cleaning burden rates, billable hours, and estimates that hold margin.
Private-industry employers in the United States did not buy an hour of cleaning for the number on the paycheck. In December 2025, labor burden, the employer cost of wages plus benefits, was 29.9% of private-industry compensation. The Bureau of Labor Statistics reported average compensation of $46.15 per employee hour: $32.36 in wages and salaries and $13.79 in benefits.
That split is the pricing problem. A cleaner's posted wage is what the worker earns. Labor and burden together are what you pay to keep that hour available. Estimates built on the wage alone underbid the job before the van leaves the driveway.
Labor is the cleaner's paid time that produces the job. Labor burden is every extra employer dollar required to keep that hour on the schedule. The December 2025 split shows the second number is not a rounding error. Benefits were nearly a third of compensation across private industry, which means a wage-based estimate starts short on every ticket.
Take a cleaner paid $20 an hour. Apply that same private-industry ratio and the benefits burden averages about $8.52. Total compensation sits near $28.52 before overhead, drive time, or gaps between houses. Price the hour at $20 and you are already $8.52 underwater, and you have not bought a single trash liner.
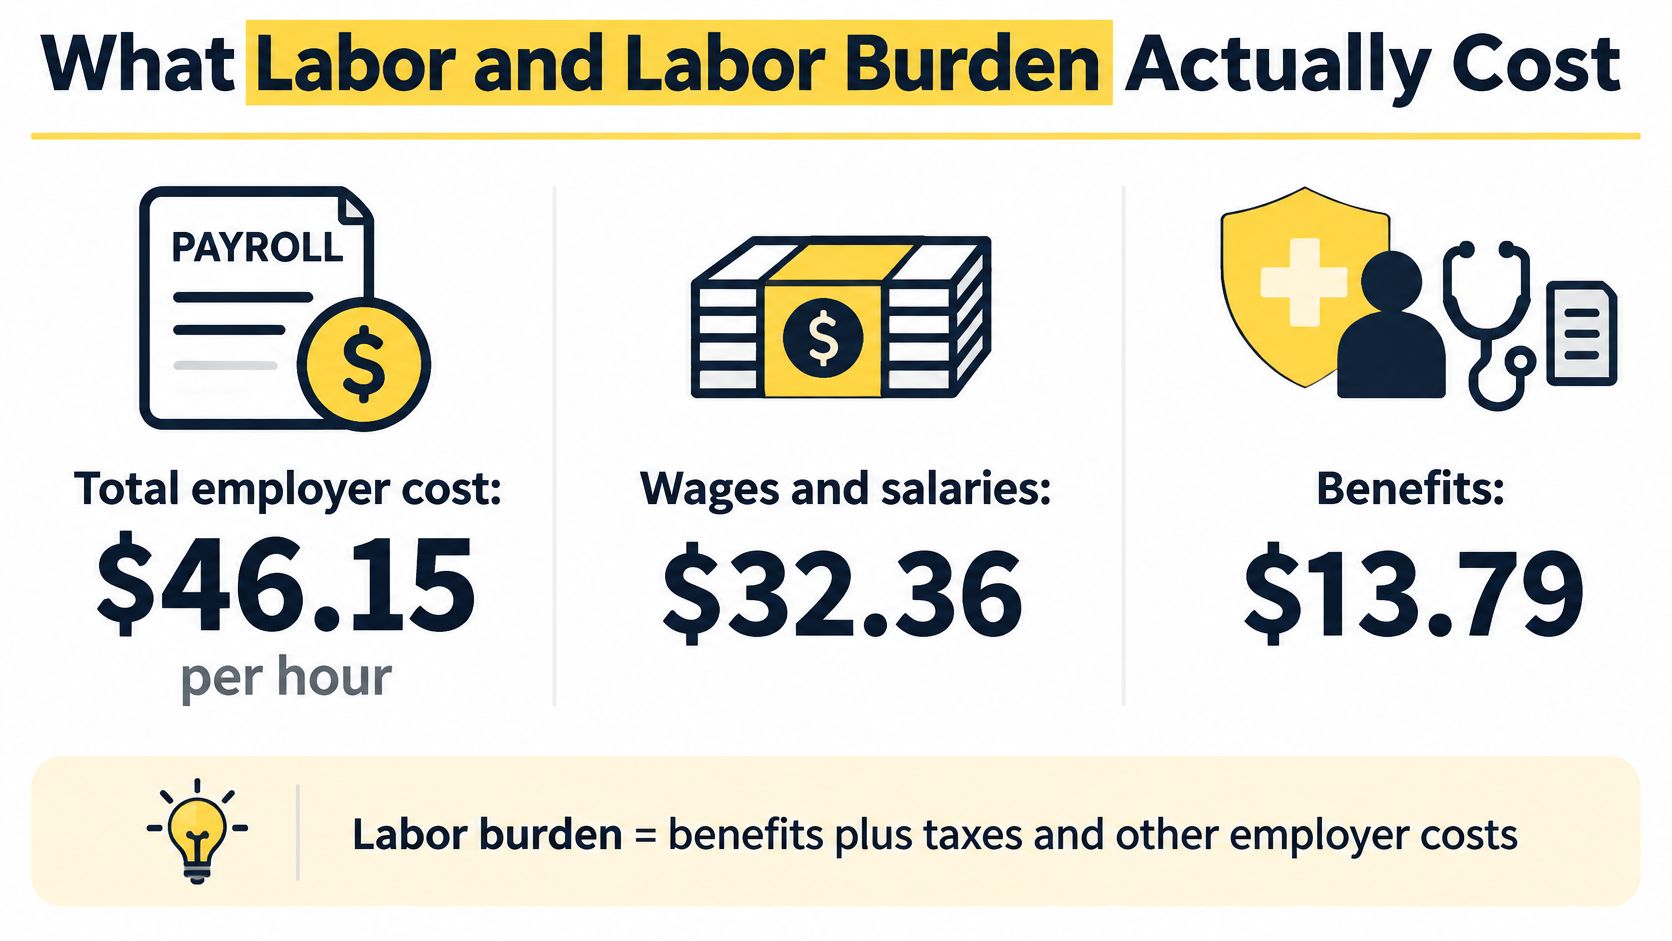
Those benefit dollars are a defined bucket, not a vague perk. They include paid leave, supplemental pay, insurance, retirement and savings plans, and legally required programs such as Social Security, Medicare, unemployment insurance, and workers' compensation. The National Compensation Survey tracks 18 benefit categories so you can separate direct pay from the cost of keeping labor capacity on the books.
Wage-only pricing fails whether you sell by the hour or by square footage. Square footage still consumes minutes, and minutes still carry benefits. The exact dollar moves with location, worker classification, benefit eligibility, overtime, payroll taxes, and workers' compensation class codes. Pasting $28.52 onto every estimate is just a different guess.
Practical rule: Build a company-level loaded rate from your own payroll report, then price from that rate. The national average is a warning light, not a line item you copy.
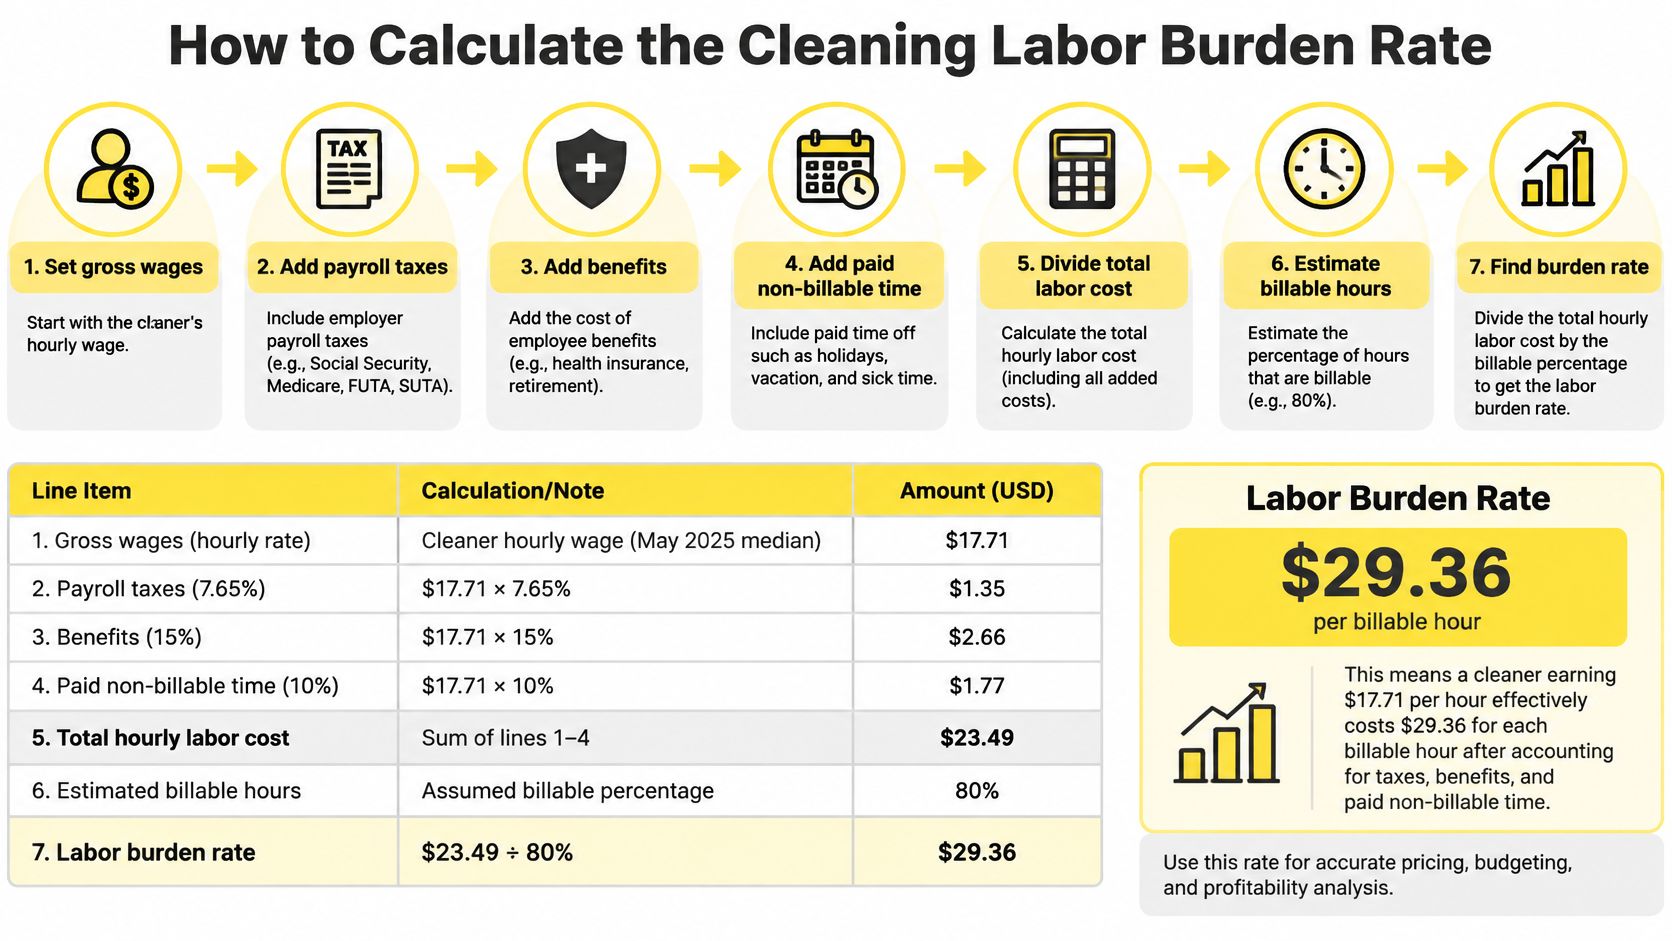
Run the math on one employee before you touch a customer estimate. In May 2025, janitors and building cleaners had a median wage of $17.71 an hour, or $36,840 a year, across about 2,432,600 jobs, and the Bureau of Labor Statistics occupational outlook projects employment up 2% from 2025 to 2035. Direct pay is already large. Taxes and benefits sit on top of it. This worked example uses $18, close to that median. It is a sample, not tax advice. Replace every rate with your payroll report before you send anything.
Overtime, multi-state work, and worker classification change the inputs. If cleaners cross 40 hours, price the premium from the rules, not from habit. HR Management 365 on overtime rules is a useful check on what counts as time worked before you lock a weekly schedule.
| Cost layer | What the figure assumes |
|---|---|
| Base wages | $18 × 2,080 paid hours = $37,440 |
| Employer FICA | 7.65% of wages = $2,864 |
| FUTA | 0.6% of the first $7,000 = $42 |
| State unemployment example | Sample state amount of $250 |
| Workers compensation example | 4.5% of wages = $1,685 |
| Paid leave example | Eight paid days at $18 = $1,152 |
| Health contribution example | $300 a month = $3,600 |
| Total before overhead | $47,033, or $22.61 per paid hour |
Swap every sample rate for the number on your payroll report. A copied class code or the wrong state unemployment rate will quietly miss the margin on every recurring visit.
Sort every dollar into one of three piles so nothing gets counted twice. Mixing them is how owners either double-charge insurance or forget the scheduler entirely.
Payroll taxes are mandatory add-ons on wages. Social Security, Medicare, federal unemployment, and state unemployment each have their own wage base. Once wages pass a base, that tax stops for the year. A flat percent on every dollar all year overstates FUTA and can overstate state unemployment.
Benefits are promises you fund whether or not that hour shows up on an invoice. Paid leave, health contributions, and any retirement match belong here. A day of vacation still costs the loaded wage, and the house that day was supposed to cover never got cleaned. If you want staff to stay, look at benefits that go beyond the basics and then put the full annual cost into this pile, not into a slogan.
Overhead is the cost of having a crew ready. Payroll processing, uniforms, mileage that is not billed on a single ticket, software, insurance beyond workers' compensation, and a share of supervisor or owner time spent scheduling all live here. Say $12,000 of annual overhead is spread over 4,000 productive team hours. That adds $3.00 to each productive hour. The method for spreading those costs is the same discipline covered in how to calculate overhead costs.
Keep job consumables out of the hourly burden. Chemicals, vacuum bags, and trash liners belong on the visit. A contractor arrangement does not erase cost. It relocates insurance, recruiting, and coverage risk, and classification is a legal question for your advisor, not a pricing trick.
If the cost disappears when there are no employees, it is labor burden or labor overhead. If it disappears when a house is skipped, it is a job cost. Put each dollar in one pile and leave it there.
One national hourly rate leaks margin as soon as you cross a metro line. In March 2025, BLS regional compensation figures put private-industry compensation at $45.38 an hour nationally, from $31.89 in wages and $13.49 in benefits.
| Area | Total compensation per hour | What drives the gap |
|---|---|---|
| United States | $45.38 | $31.89 wages plus $13.49 benefits |
| Northeast | $56.32 | Highest regional total, and the gap is wage-led |
| Midwest | $41.81 | Lower wages than the national total |
| South | $39.71 | Lowest regional total in this release |
| West | $49.50 | Above the national total, still wage-led |
Benefits stayed near 28.3% to 30.8% of compensation, so the gap is mostly wages, not a different tax recipe. These figures cover all private industry, not janitors alone. Use them as location multipliers beside your payroll, not as a price to paste onto an estimate. How those locals show up in customer-facing numbers is a separate question from house cleaning rates.
A $5 difference in loaded cost is not small. On 180 productive minutes it changes labor expense by $15 per visit. Across 200 monthly visits that is $3,000 a month. Keep a labor-rate row per metro. Build each estimate from expected labor minutes times that row's loaded cost per productive minute, then add consumables, travel, payment costs, rework risk, and profit. A flat price per room cannot see that a West-region hour and a South-region hour are not the same input.
A posted wage is what a cleaner earns, not what a customer should be billed. The gap grows whenever paid time cannot be invoiced. Cleaning owners still pay for travel between homes, cancellations, lockouts, rework, supply loading, payment follow-up, and gaps between jobs. Those hours raise the cost of every billable minute, even when the wage and payroll burden stay the same.
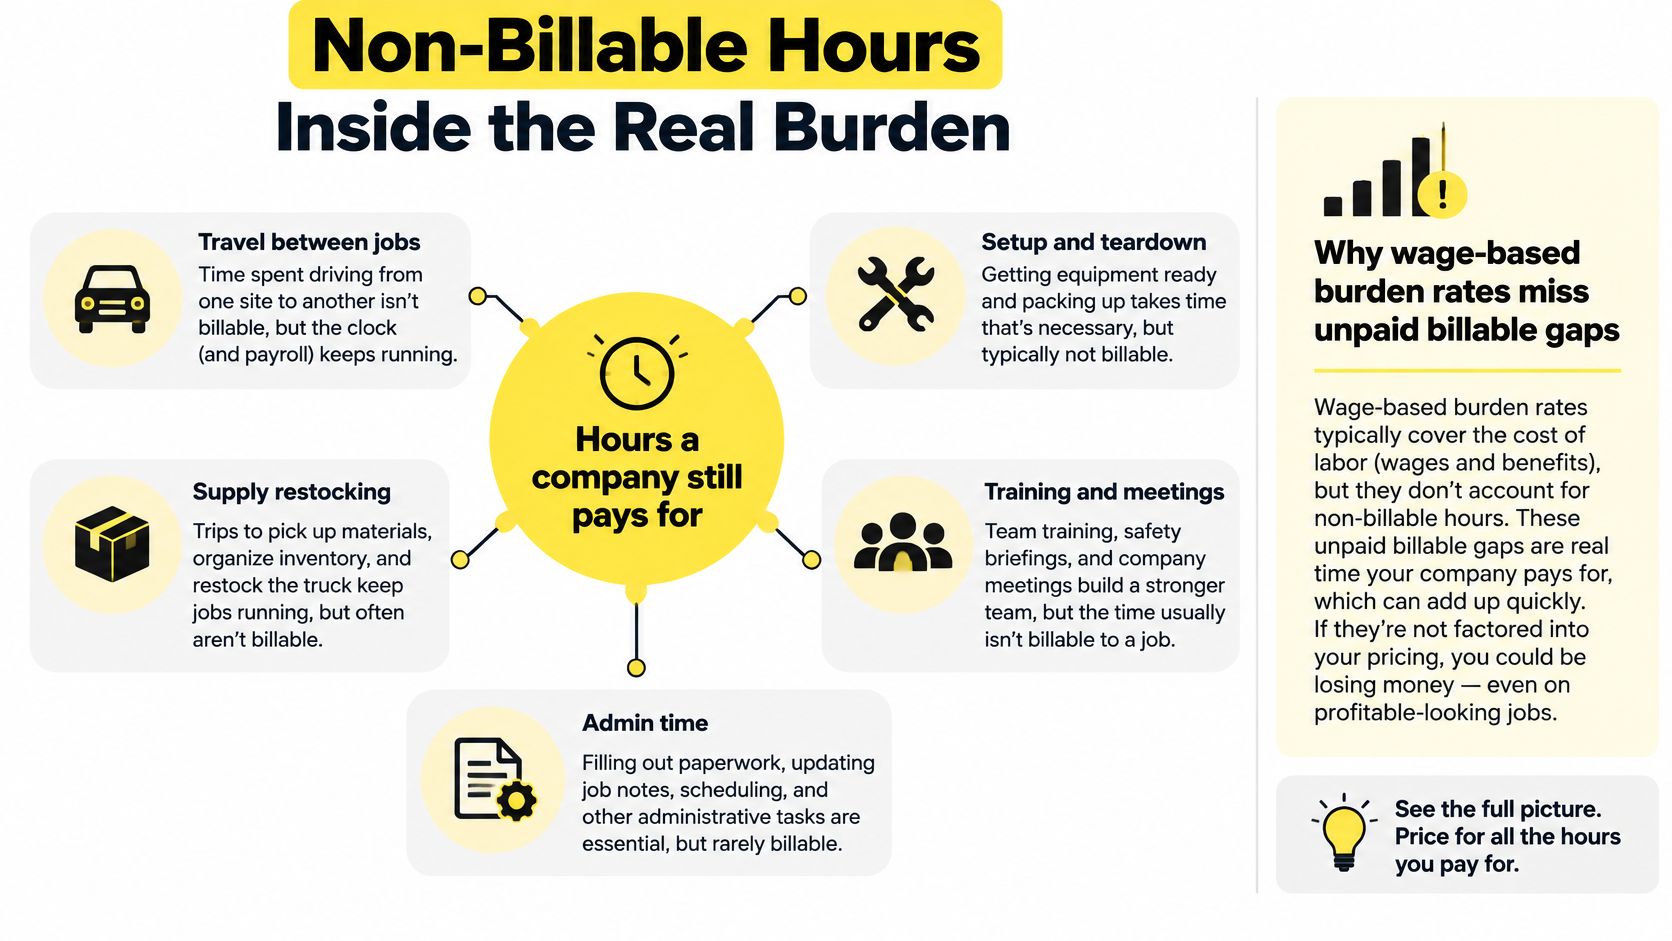
Keep the ledger clear: paid productive hours, paid nonproductive hours, travel, supplies, payroll taxes, insurance, and owner or manager labor belong on separate lines. The burden rate captures the cost of employing the cleaner. Utilization shows how much paid time becomes invoiceable work. Both affect the price, but they answer different questions. For a fuller view of the books, use a consistent approach to cleaning business accounting.
Start with the sample paid-hour cost of $22.61 and divide it by the share of time you can bill. At 70% utilization, for example, each billable hour must carry the cost of more than one paid hour.
| Billable utilization | Cost per billable hour | What it signals |
|---|---|---|
| 80% | $28.26 | Routes are tight and cancellations are controlled |
| 70% | $32.30 | A workable planning assumption for a scattered residential week |
| 60% | $37.68 | Idle time has inflated every invoice |
A higher estimate cannot correct loose routes, free cancellations, or zero booking minimums. Those choices leave paid hours unbilled, so the cost still sits inside each job. Track productive and nonproductive time separately; otherwise, idle hours can disappear from view until the month is already lost.
Set a minimum profitable booking using billable minutes multiplied by the utilization-adjusted rate. That amount must cover supplies and travel, with enough left for target profit. If a visit falls short, decline it or cluster it with nearby work. Don't rely on the next house to pay for the gap.
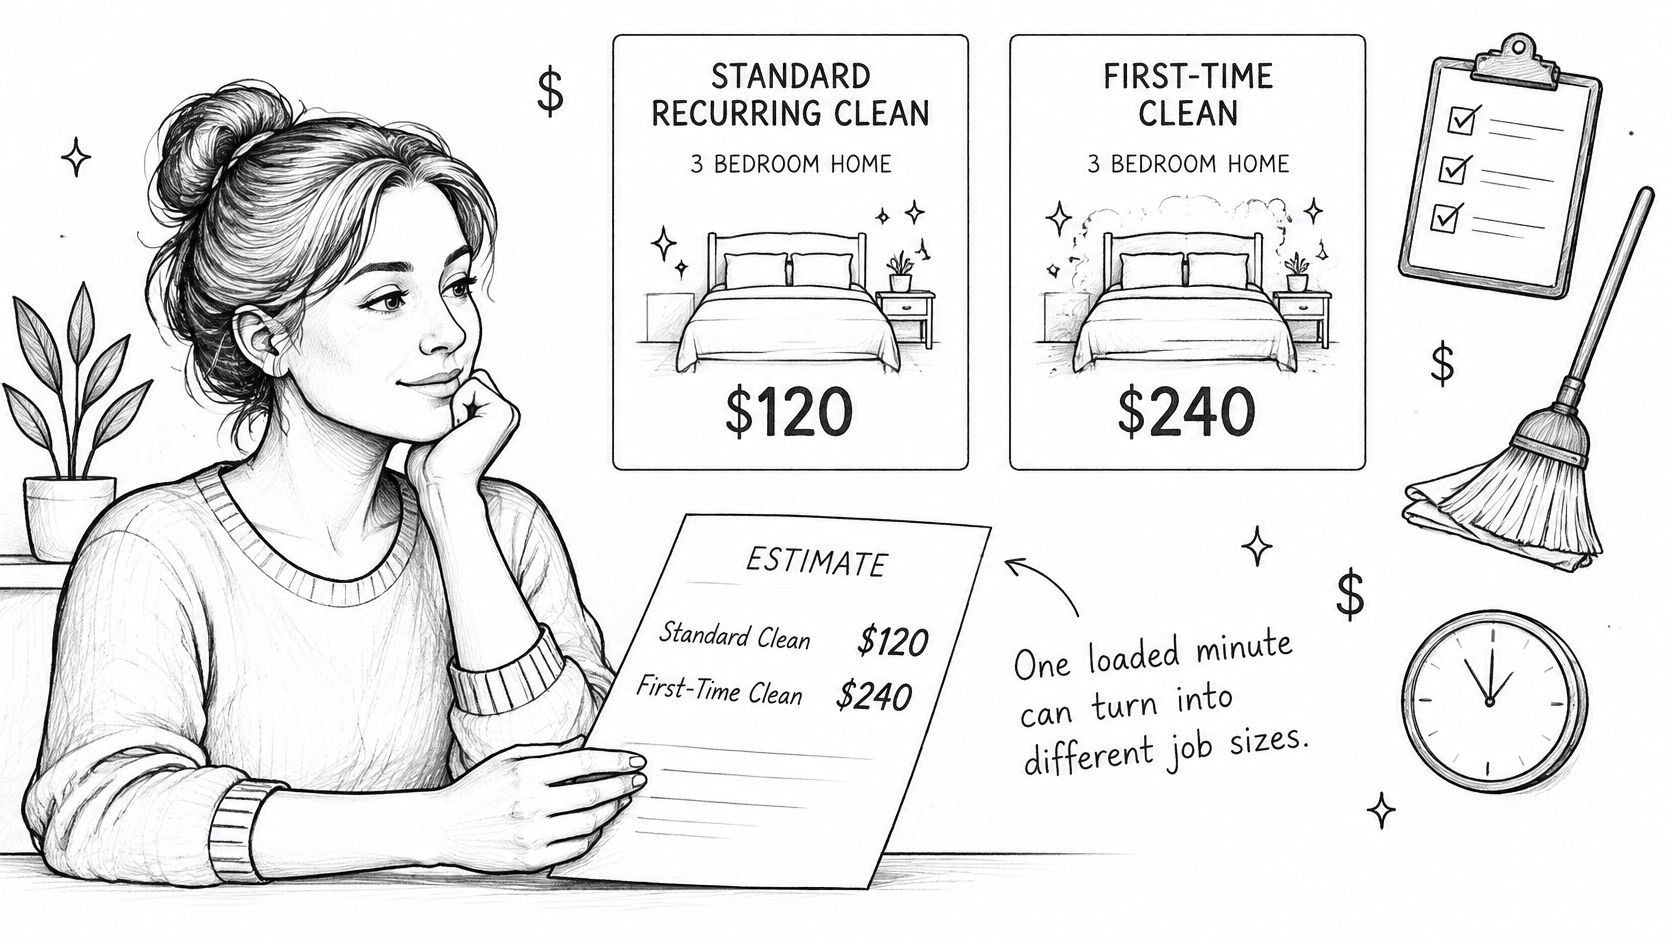
Price one recurring clean and one heavier visit from the same loaded minute. The number you store is minutes plus condition and location, not a flat price per room.
Say the house needs 180 productive minutes, or 3.0 hours. At the 70% utilization rate of $32.30, labor is $96.90. Add $8 of supplies, a $12 travel allocation, and a $6 reserve for card fees and occasional rework. Cost is $122.90. A 20% profit on cost is about $24.58, so the estimate lands near $148 before any same-day or add-on fees.
The wage-only mistake is 3 × $18 = $54. That leaves roughly $94 uncovered against the estimate you need. You didn't discount. You forgot the truck, the taxes, and the hours that never hit an invoice.
A move-out at 5.0 productive hours uses the same $32.30, so labor is $161.50. Scale supplies to $20, keep travel at $12 and the reserve at $6, and cost is $199.50. The same 20% puts the estimate near $239.
Change the minutes before you change the price when the house isn't a standard maintained clean.
Before you trust the minutes, pull them from your job log. Average productive minutes per room type, per condition level, and per add-on, then check that result against the crew's actual billable hours each month. Store minutes by visit type so the next estimate starts from recorded time. How you present that number to the customer belongs with business pricing strategies, but the minute comes first.
Build each estimate from the loaded productive minute. Before sending a price, record the service location, home size, condition, urgency, and expected labor minutes. Apply the regional loaded cost per productive minute, then adjust for utilization. Flat per-room prices and wage-times-hours guesses can leave payroll costs uncovered.
Set a written minimum charge and cancellation window. Unpaid time should not fall entirely on margin, and clear terms help crews plan their hours. Compare actual utilization with the 70% assumption each month. If utilization drops below that level, raise minimums or tighten routes to cover the added cost per billable minute.
A busy week alone is not a sound basis for hiring. Set staffing to the schedule you can consistently fill. For estimating, Estimatty gathers square footage, surfaces, and urgency online or by phone, then sends consistent estimates by SMS and email. That keeps after-hours inquiries from relying on memory. Use this guide to estimate cleaning jobs with a repeatable process.
Keep every new estimate in draft until its labor minutes and loaded rate are set. Estimatty can collect job details and send estimates at any hour. If pricing starts with the posted wage, payroll costs that are missing from the invoice cut into the job's margin. Set up Estimatty's pricing for your loaded rate, then use it to send your next estimate.